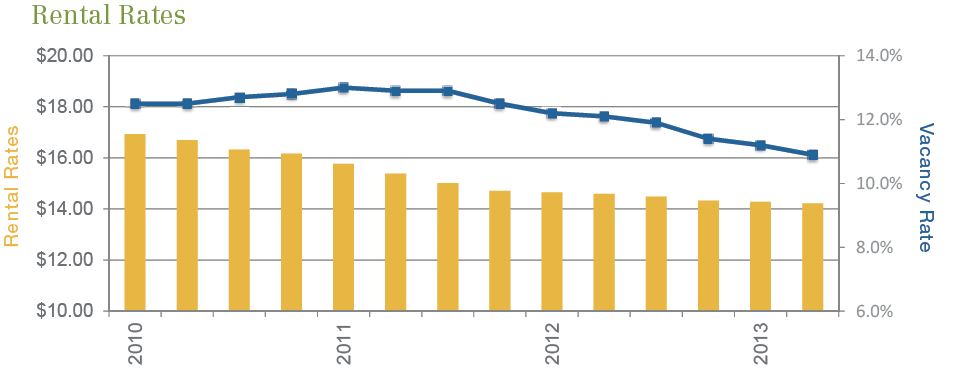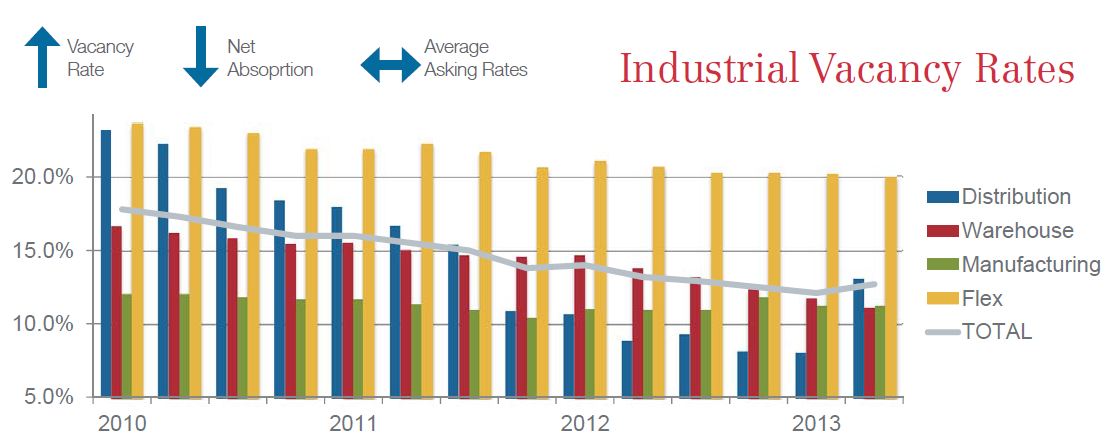
While the momentum has been slow, the Phoenix market is showing signs of recovery. As of the third quarter of this year, the office and retail sectors have both seen a significant decline in vacancy from just a year before; office vacancy is down to 19.8% from 21.5% in the third quarter of 2013, and retail has fallen to 10.5% from 11.9% just a year before. The industrial sector has seen a slight increase in vacancy coming in at 12.9% this quarter, but is still down from the highs seen in 2011 when vacancy rates were over 15.5%. Both the office and retail sectors showed impressive net absorption this quarter with more than 1 million SF of space absorbed, while industrial remained relatively stagnant from the previous quarter with a loss of 190,000 SF. While leasing activity in the office sector remained relatively the same in terms of SF leased and number of deals, the retail and industrial sectors saw slight drops in activity this quarter. As expected, the consistent nature of the market continues as the Phoenix area begins to define a new norm.
Recovery has been tracked on a nationwide scale as well. The six major metro areas have averaged a price recovery of 90% of peak compared to non-major metro areas averaging a 75% recovery. Of these six major metro areas, two have met previous peak-price levels, compared to just three among the remaining non-major metros nationwide, including Dallas, Houston, and Austin. Increased purchasing activity was also recorded across all property types in the U.S. as of August, with a recent influx of institutional and private buyers for retail properties causing prices to rise faster for the retail sector than others. Conversely, the multifamily sector has experienced a slowing of price gains after consistently leading the other sectors, potentially due to the slowing of the recent rush to rent by those hit in the housing downfall. Sales of significant commercial property nationwide totaled $24 billion in August, up 12% year-over-year.

As of September, the unemployment rate for the Phoenix Metropolitan Area sat at 6.9% compared to the national rate of 7.3%. The Valley also continued to recover in the residential sector, with one-year house value growth coming in at 18.5% in September. According to the On Numbers Economic Index, Phoenix ranked No. 29 in September, up two places from August. This ranking, a monthly snapshot of economies in the nation’s top 102 metropolitan areas by population, is an overall score based on 18 categories, including various job growth indicators, home value, and earnings information. Leading the ranks in the On Numbers Economic Index is Austin at number one, with Provo, Dallas-Fort Worth, Houston, and Oklahoma City rounding out the top five.
In September, the W.P. Carey School of Business and the Center for Real Estate Theory and Practice held a survey and panel discussion to gauge the current commercial market from those who know it best, brokers. Overwhelmingly, the experts believe that Phoenix Metro is currently in the recovery stage, with 87% of brokers in agreement. In addition, the majority of brokers believe that vacancy rates are on the decline and will trend down in the fourth quarter for the retail, industrial, and office sectors. Positive news was also forecasted for rental rates with more than 40% of the vote in all sectors and categories pointing to rates stabilizing and remaining stationary for the next 3 months; the second most popular vote predicted increased rates in almost all categories. These opinions point to a positive future with effects of the recession moving farther into the rearview mirror.